Saturday, 23 April 2016

My Complete CV

muhammad ilyas siddiqui
                                          (Economics Lecturer)
172-A tanki ground,marghzar colony, gujrat
mrgm2277@yahoo.com
Cell# 0344-4557172
Cell# 0331-5549481
skype id: ilyassidd

EDUCATION

MS Economics                                   (CGPA 3.83/4.00)                    2016
M.Sc. Economics                             (1st Division)                          1995
B.Sc. (Biology, Chemistry)             (2nd Division)                           1988
Intermediate                                    (1st Division)                            1984
Metric                                               (1st Division)                         1982            

Research

Submitted 15000 words thesis on “Monetary Policy Transmission Mechanisms: The Role of Stock Prices” as per requirement of MS Economics
Research papers “Money Redefined” and “The Discovery of Differential Principle in Economics” are ready to go press.
                                                                            
EXPERIENCE

Lecturer                                                                       March 2016 – Present
Company Name, University of Central Punjab, Gujrat Campus.
Areas: Macroeconomics, Microeconomics, Development Economics.
Responsibilities:  Handling class room activities
Conduct research projects, assignments, quiz, etc.

Lecturer                                                                              2007 – Present
Company Name, Punjab College Gujrat
Preparation of Course Outline
Conducting  test system
Worked as evening classes coordinator
Event Management
Achieved 100% result for the subject
Managed Examinations
Tours Event Management

Lecturer                                                                                                                2006  –  2007
Company Name, AIOU Lahore Center
Teaching Economic Analysis To MBA Classes
Managed Examinations
Preparation of assignments
Arrangement of Demonstrations

Lecturer                                                                                1997  – 1998
Company Name, Federal Govt. College Kharian Cantt.
Teaching intermediate & bachelor classes
Examination conduction
Paper Setting

Lecture                                                                                       1995  – 1997
Company Name, Govt. Zamindar Degree College,Gujrat
Teaching MA Classes
Subjects taught : Microeconomics, Macroeconomics, Econometrics, Monitory Policy
Examination conduction
Paper Setting
Supervision of research activities


TRAININGS & SHORT COURSES

Training On Motivation (By Dr. Moiz Amjad)
Training On Anti-terrorism From 1122
State life Insurance Policy Management
Diploma In Computer Applications
Certification in Accounting and Finance (Peachtree)
National Cadet Corps   2 year training


ACTIVITIES & INTERESTS

Sports –     Cricket, Soccer
Hobbies –  Reading Books, Internet, Economic Research

Communications / Language
Fluent in English & Arabic Communication Speaking, Writing, Reading, Listening


Skills

Teaching
Islamic Banking and Finance
MS Office 2010
Internet Usage
Windows 7
Office Administration
Event Management
Tours Organizer


AREAS OF INTEREST

Microeconomics   Macroeconomics   Econometrics
Monetary Policy    Islamic Economics
DISTINCTIONS

President of Biological Society at Govt. Zamindar Degree College, Gujrat
Author of “Easy Pick” An Innovative approach to English Grammar and Translation
Rozan Publisher Gujrat 2014.


References would be available on request.

Friday, 22 April 2016

Pak external debt, debt-to-GDP ratio alarming

Business
Pak external debt, debt-to-GDP ratio alarming
By Sabir Shah
LAHORE: Now that the International Monetary Fund (IMF) has estimated that Pakistan's external debt obligations would surge to $70.2 billion by end of the current fiscal, up from the $66.457 billion mark in September 2015, alarm bells might certainly have started ringing for the country's candid economic wizards to respond to the situation. The IMF has also predicted that Pakistan's debt-to-GDP ratio is all set to touch the 65 percent mark within the next few months.
Interestingly, not very long ago, some key functionaries of the incumbent PML-N government had claimed that the country's debt-to-GDP ratio had dropped to 59.1 percent in October 2015 from a high of 64 percent in 2013.
On the contrary, the IMF estimates, calculations and projections are painting a very different picture altogether.
The picture is both bleak and frightening.
Pakistan may still not be the most indebted of countries, but its poor debt-to-GDP ratio bears ample testimony to the fact that country's economic managers, serving successive regimes, have not succeeded in initiating appropriate, comprehensive and timely fiscal/monetary reforms that were otherwise required to raise revenues, restructure the loss-making Public Sector Enterprises and contain the non-targeted subsidies dished out to the energy sector.
Plunged into a vicious debt trap, Pakistan has historically borrowed loans with a lot of "pride and pleasure," primarily to repay its outstanding debts.
Here follows the synopses of Pakistan's debt history:
Research shows that the need for foreign assistance had begun shortly after independence and Pakistan had received $121 million from 1951 to 1955.
This figure nearly had tripled in the next five years as Pakistan had started to play an increasingly important role in the Cold War.
At the end of December 1969, the external debt of Pakistan had amounted to $2.7 billion including the debt of Bangladesh.
Therefore, Pakistan’s total external debt was $3 billion by December 1971 or at the time when the East Pakistan tragedy had rocked the country.
This foreign debt figure had then subsequently increased to $6.3 billion in 1977, soon after the late General Ziaul Haq had held the reins of the country.
Between December 1969 and December 2012, the external debt of Pakistan had jumped by 2,354 percent, from just $2.7 billion to $66.243 billion.
Pakistan's external debt was $21.9 billion in 1990, $22.8 billion in 1991, $24.8 billion in 1992, $27.6 billion in 1993, $31.1 billion in 1994, $32.7 billion in 1995, $34.7 billion in 1996, $35.8 billion in 1997, $35.8 billion in 1998, $36.5 billion in 1999 and $35.6 billion in 2000.
The debt-to-GDP ratio was 78.5 percent in 1995, 73.3 percent in 1996, 73.4 percent in 1997, 74.1 percent in 1998 and 76.2 percent in 1999.
We all know that both Nawaz Sharif and late Benazir Bhutto had enjoyed two stints each in office between 1988 and 1999.
Further breakdown of the period shows that the external debt had grown at an average annual rate of 9.3 per cent during the 1990-91 to 1994-95 period.
The rate of accumulation had slowed down to an average of almost one per cent per annum during the 1995-96 to 1998-99 period.
External debt had grown at an average rate of 5.2 percent per annum during the first nine years of the 1990s.
Pakistan's accumulated disbursed and outstanding external debt (short, medium and long term) had stood at $ 30.2 billion at the end of June 1999.
When General Musharraf had taken over in October 1999 by toppling Nawaz Sharif, Pakistan’s total public debt as percentage of its GDP was the highest in South Asia – 99.3 percent of its GDP and 629 percent of its revenue receipts, compared to Sri Lanka (91.1 percent & 528.3 per cent respectively in 1998) and India (47.2 percent & 384.9 percent respectively in 1998). 
The debt-to-GDP ratio was 81 percent in 2000, 83 percent in 2001, 87.9 percent in 2002, 81.8 percent in 2003, 75.9 percent in 2004, 68.3 percent in 2005, 63.5 percent in 2006, 57.5 percent in 2007, 54.9 per cent in 2008, 59.6 percent in 2009, 60.7 percent in 2010, 61.5 and 60.1 percent in 2012.
By the end of 2004, the total external debt was resting at $33 billion.
At the end of June 2007, when General Musharraf was still in power, the loans had soared to $40.5 billion.
However, the country's real GDP had increased from $60 billion to $170 billion during 2000-07, while its per capita income had increased from under $500 to over $1000 during this period.
During the Musharraf regime from 2001 to 2008, the foreign donors had disbursed gross amount of $22.469 billion as loans and grants, but the country had to pay back $17.220 billion as debt servicing ($11.260 billion as principal amount and $5.595 billion as interest repayments).
Between June 1999 and December 2012, Pakistan’s foreign debt has registered an upsurge of nearly 120 per cent, up from at $30.2 billion to rest at a whopping $66.243 billion.
These foreign debt obligations had risen to $55.9 billion by the end of June 2010, and stood at $ 59.5 billion by end March 2011.
The former PPP-led coalition government had borrowed huge amount of Rs8,136 billion from internal and external resources during its five years constitutional tenure to finance its budget deficit.
The break-up of Rs8,136 billion as follows: Rs1,233 billion borrowed in financial year 2008-09, Rs1363.8 billion in 2009-10, Rs1566.5 billion in 2010-11, Rs1860.5 billion in 2011-12 and Rs2112.3 billion in fiscal year 2012-13.
From 2009 to 2015, Pakistan's democratic governments had received gross foreign assistance of $27.483 billion, but had paid back $22.111 billion as debt servicing including $16.436 billion as principal repayment and $5.675 billion as interest repayment.
It is imperative to note that during the PPP regime, the country’s public debt had increased substantially by Rs6,924 billion between March 2008 and March 2012, reaching a monstrous figure of Rs11,726 billion.
Ironically, during the first 60 years of its independence, the country’s public debt had stood at just Rs4,802 billion!
It goes without saying that since the rupee-US dollar parity has worsened from Rs51.77 in fiscal 1999-2000 to well over Rs100 now, Pakistan's miseries on this front have compounded fast.
History shows that there have been only three occasions when Pakistan's balance of trade has recorded a surplus. The first was in 1947-48 when the import requirements of the newly born country were not yet well defined.
Second, in 1950-51, the balance of trade surplus was caused by the Korean War boom leading to an increase in the international prices of Pakistan's major primary commodities. Third, it was the devaluation of Pakistan rupee in May 1972 and diversion of exports from former East Pakistan to foreign markets that had helped achieve a surplus in 1972-73.
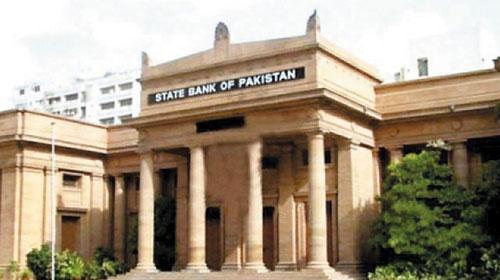
In its Annual Report 2012–2013, the State Bank of Pakistan had stated: "The country's public debt is still 63.3 percent of GDP – higher than the ceiling of 60 percent under the Fiscal Responsibility and Debt Limitation Act (FRDL) of 2005. Comparing with other countries, Pakistan's debt is significantly above the average for emerging and low income countries. It also shows that unlike other emerging economies, Pakistan's debt burden is rising. Such mounting debt will have adverse consequences for the economy: it will hold back economic growth; limit the scope for discretionary (monetary and fiscal) policies; increase vulnerability to exogenous shocks; raise the tax burden on captive payers, which will discourage investment; and create more uncertainty in the economy."
According to the State Bank of Pakistan, the country's Debt to GDP ratio had averaged 69.75 percent from 1994 until 2014, reaching an all time high of 87.90 percent in 2001 and a record low of 54.90 percent in 2007.
In June 2015, every Pakistani was owing a debt of about Rs101,338. This figure was Rs90,772 in 2013, Rs80,894 in 2012 and had stood at only Rs37,170 in early 2008.
During the question hour in the Senate a few days ago, Finance Minister Ishaq Dar had stated on record that Pakistan has borrowed a staggering $1.42 billion from foreign countries and financial institutions during the past three months.
Of this $1.42 billion, according to the IMF, the government had opted to borrow $956 million from the commercial banks without competitive bidding to meet its foreign currency reserves related requirements.
The debt-to-GDP ratio is simply a measure of a country's debt compared to its economic output. It also indicates the country's ability to pay back its debt.
Basically, a low debt-to-GDP ratio indicates an economy that produces and sells goods and services sufficient to pay back debts without incurring further debt.
The World Bank and the IMF define debt-to-GDP ratio as:"A country can be said to achieve external debt sustainability if it can meet its current and future external debt service obligations in full, without recourse to debt rescheduling or the accumulation of arrears and without compromising growth."
It certainly is not a cardinal sin to borrow money, because the most advanced of nations happens to be the most indebted of all.
While they resort to heavy borrowing to stimulate their respective economies, the men at the helm of affairs of developed nations also ensure that they are not imprudent enough to neglect other vital sectors such as creation of employment chances for their jobless compatriots.
In its September 29, 2014 edition, the "Forbes" magazine had viewed: "If the government is borrowing to stimulate its economy, for example, to create work programmes for the unemployed, then it hopes that this will shorten the duration and severity of the economic downturn. In any event, excess government borrowing for whatever reason, has to be repaid and that’s where this ratio is useful. Although there is no specific percentage to indicate when a critical point is approaching, a lower ratio is better."
The calculation of any country's debt-to-GDP ratio is simple.
Suppose "country A" has debt in the amount of $1.5 million and a GDP of $1.0 million. To calculate its debt-to-GDP ratio, you would divide the amount of its debt by its GDP. In this case, it will be $1.5 million / $1.0 million = 150 per cent.
Hence, "country A’s" debt-to-GDP ratio is 150 per cent since its debt is 50 per cent greater than its GDP.
A research undertaken by the "Jang Group and Geo television Network," by taking into account the latest available figures quoted by the CIA World Fact Book, World Bank and the IMF, reveals that the following are the world's 25 most indebted nations:
The United States ($18.772 trillion on December 2015), France ($5.750 trillion on March 31, 2014), Germany ($5.547 trillion on March 31, 2014), Luxembourg ($3.472 trillion on March 31, 2014), Japan ($2.861 trillion on March 31, 2014), Italy ($2.651 trillion on March 31, 2014), Netherlands ($2.527 trillion on March 31, 2014), Spain ($2.306 trillion), Singapore ($1.813 trillion), China ($1.680 trillion), Switzerland ($1.611 trillion), United Kingdom ($1.524 trillion), Australia ($1.396 trillion), Canada ($1.337 trillion), Hong Kong ($1.29 trillion), Belgium ($1.287 trillion), Sweden ($1.146 trillion), Austria ($820 billion), Norway ($737 billion), Russia ($599.82 billion), Denmark ($593.22 billion), Portugal ($548.8 billion), India ($455.9 billion), Brazil ($428.3 billion), South Korea ($425.35 billion) and Turkey ($405.22 billion).
Among the key Muslim countries, Saudi Arabia's foreign liabilities stand at $134 billion but its debt-to-GDP ratio is an exemplary 1.60 per cent only.
In Indonesia's case, it is 25.02 percent (total external debt of $298.1 billion), it is 90.50 percent in Egypt (total external debt of $ 48.76 billion), 86.68 percent for Jordan (total external debt of $8.34 billion), 52.80 percent for Malaysia (total external debt of $230.870 billion), 49.95 percent for war-ravaged Yemen (total external debt of $6.73 billion), hardly 37.02 for Iraq (total external debt of $50.27 billion), just 30.01 per cent for Syria (total external debt of $11.64 billion), a magnificent 18 per cent for Bangladesh (total external debt of $36.21 billion) and 16.36 percent for Iran (net external liability of $9.45 billion).
But despite featuring amongst the most indebted nations, the debt-to-GDP ratios of various developed economies are simply fabulous.
Here follow the debt-to-GDP ratios of the most heavily indebted countries:
The United States (102.98 per cent), France (95 per cent), Italy (132.30 per cent), India (66.10 per cent), China (41.06 per cent), Japan (230 per cent), Spain (97.70 per cent), Netherlands (68.80 per cent), Germany (74.70 per cent), United Kingdom (89.40 per cent), Brazil (58.91 per cent), Russia (17.92 per cent), Canada (86.51 per cent), Australia (33.88 per cent), South Korea (35.98 per cent), Portugal (130.20 per cent), Belgium (106.50 per cent), Singapore (99.30 per cent), Austria (84.50 per cent), Denmark (45.20 per cent), Sweden (43.90 per cent), Switzerland (34.20 per cent), Turkey (33.00 per cent), Hong Kong (32.00 per cent), Norway (26.40 per cent) and Luxembourg (23.60 per cent).
In order to measure the financial and economic strengths of the most heavily indebted countries mentioned above, here follow their respective GDPs (as estimated by the IMF in 2014):
The United States ($17.348 trillion), China ($10.357 trillion), Japan ($4.602 trillion), Germany ($3.874 trillion), the United Kingdom ($2.950 trillion), France ($2.834 trillion), Brazil ($2.346 trillion), Italy ($2.148 trillion), India ($2.051 trillion), Russia ($1,861 trillion), Canada ($1.785 trillion), Australia ($ 1.443 trillion), South Korea ($1.410 trillion), South Korea ($1.410 trillion), Spain ($1.407 trillion), Netherlands ($881 billion), Turkey ($798 billion), Switzerland ($704 billion), Sweden ($571 billion), Belgium ($534 billion), Norway ($499.82 billion), Austria ($437.58 billion), Denmark ($342.36 billion), Singapore ($307.87 billion), Hong Kong ($290.90 billion), Portugal ($229.95 billion)and Luxembourg ($65.68 billion).
Here follows the net international investment position (the difference between a nation's external financial assets and liabilities) of these countries under review:
Hong Kong (+6,398.765 billion Hong Kong dollars), Singapore (+710.039 billion Singapore dollars), Norway (+5,383.157 billion Norwegian Krones), Switzerland (+768.343 billion Swiss Francs), Japan (+366,856.000 billion Yens), Netherlands (+421.278 billion Euros), Belgium (+199.930 billion Euros), Luxembourg (+20.761 billion Euros), Denmark (+728.010 billion Danish Krones), Germany (+1,055.879 billion Euros), China (+1,776.400 billion US dollars), Russia (+310.980 billion US dollars), South Korea (+134.200 billion US dollars), Canada (+137.173 billion Canadian dollars), Austria (+8.669 billion Euros), Sweden (-13.393 billion Swedish Kronas), India (-353.674 billion US dollars), France (-418.373 billion Euros), United Kingdom (-444.537 billion Pounds), Italy (-447.864 billion Euros), Brazil (-776.537 billion US dollars), United States (-7,019.700 billion US dollars), Turkey (-437.029 billion US dollars), Australia (-866.700 billion Australian dollars), Spain (-999.948 billion Euros) and Portugal (-193.075 billion Euros).
As far as the United States and Japan are concerned, despite their adverse debt-to-GDP ratios and their ever-rising debt burdens, they have continued to accumulate foreign assets.
The US Council on Foreign Relations had opined a short while ago: "The dollar's status as the world's reserve currency has become a facet of US power, allowing the United States to borrow effortlessly, sustain an assertive foreign policy and afford large debt-financed military commitments. Since 1982, the country has run a current account deficit every year but one, steadily piling up obligations to foreigners."
It had added: "Because foreigners have been eager to hold dollar assets, they have willingly enabled this pattern, pouring capital into the United States and financing the nation's surplus of spending over savings. Capital has tended to flood into the United States especially readily during moments of geopolitical stress, ensuring that the nation has had the financial wherewithal to conduct an assertive foreign policy precisely at moments when crises demanded it."
Similarly, with a debt-to-GDP ratio of 230 per cent and despite being indebted to the tune of $ 2.861 trillion, Japan has the ability to finance its deficit on its own. It has run an account surplus for most of the last three decades, selling and investing more overseas than the other way round.
The Japanese government bond market is the world's largest. It is also one of the least international. Roughly 96 percent of government securities are domestically held by the Japanese banks, insurance companies and pension funds so there is little worry about capital flight.
Much of Japan's government debt is held publicly and financed by the country's once-ample private savings. About 95 percent of Japan's debt is owned by its citizens, not foreign hedge funds; it's unlikely that those citizens would dump their bond holdings.
Japan's notably thrifty households sit on 1,500 trillion yen ($20 trillion) in savings. The Japanese government is in deep debt, but the rest of Japan has ample money to spare.
This particular factor makes the country less vulnerable to outside pressures that might cause it to default. And in theory, it gives the government plenty of leeway to print money—a spendthrift's prerogative it holds in common with the United States.
Japan, therefore, can boast the luxury of being able to issue debt in a market full of willing buyers.
However, Japanese financial institutions possess about 40 percent of government bonds. If bonds prices suddenly fall, the value of these assets would nose-dive and the financial system could plunge into turmoil.
On September 1, 2011, the New York Times had stated: "Japan has long been able to borrow at low nominal rates because of unwavering appetite by domestic investors for government debt. For years, Japan has managed its gargantuan debt load, and bond buyers have been willing to lend the government money at some of the world's lowest interest rates."—Originally published in The News

Tuesday, 19 April 2016

Economic Development


ECON2033
Development Economics
AD6
Recommended book:
Economic Development 8th edition by Smith and Todaro
Instructor: Muhammad Ilyas Siddiqui, MS Economics, IIIE, IIUI


Q1: What is development economics? Describe traditional and modern views regarding development economics.
Introduction
Economics as a subject is concerned with allocation of scarce resources. The purpose of this allocation is to meet maximum possible human needs and wants. The word “development” literally means gradual growth in a thing until it reaches to its most advanced form. In economics, development means the material well- being of people and nations; it is termed as economic development and the subject that discusses the nature and causes of economic development is known as development economics.
Traditional economics is primarily concerned with least cost or optimum combination of productive resources to produce an ever expanding range of goods and services. The traditional economics includes both classical and neoclassical economics. Political economy goes beyond traditional economics and also considers social and institutional influences on resource allocation now and in future. It gives special emphasis on role of power in economic decision making.
Economic development has become very broad term showing political, social and institutional requirements for rapid economic growth in the way that brings the fruit of economic development to all segments of society. It focuses on mechanisms that keep families, regions and entire nation in poverty traps and strategies to break out these traps.
Traditional view of development
According to this view ED is a capacity of national economy to generate and sustain an annual increase in real gross national product – GNP at the rate of 5% to 7% or more. An alternative measure is per capita GNP that includes population factor; ability of a nation to expand its output at a rate faster than its population rate. Development strategies in past also focused on rapid industrialization at the expense of agricultural and rural development. Finally, these principal measures were supplemented by non-economic social indicators – literacy, schooling, health and housing.
The new economic view of development
In 1950s and 1960s many developing countries realized economic growth targets but living standard of masses of people in these courtiers remained unchanged. The focus of most economists switched from mere calculations of GNP to major economic problems such as absolute and widespread poverty, income inequalities and ever rising unemployment rate. Therefore, development was conceived as a multidimensional process involving major changes in social structures, popular attitudes and national institutions along with acceleration of economic growth.


Q2: What are the views of Sen about development; enlist the core values and objectives of development economics in the light of Sen’s thought.
Sen’s capabilities approach
Income and wealth are not ends in itself but are instruments to other purposes goes back to Aristotle. Almost same thing was proposed by an Indian economist Amertya Sen (1933) who got Nobel Prize in 1998. According to Sen “Economic growth cannot be sensibly treated as an end in itself. Development has to be more concerned with enhancing the lives we lead and the freedoms we enjoy”. He argued that development cannot be measured properly through conventional measures, rather what a person has does not matter; what a person is, can be or “does” is matter of concern. Further, he argued that availability of commodities would not solve the problem but it is “functioning” or “abilities” that is freedom of choice and control of one’s own life along with the ability of living at par with society is real requirements for economic developments.
Three core values of development
1-    Sustenance; the ability to meet the basic needs
2-    Self esteem; to be a person
3-    Freedom from servitude; to be able to choose
The three objectives of development
1-    To increase the availability and widen the distribution of life-sustaining goods and services.
2-     To raise level of living along with high incomes, more jobs, better education and greater attention to human and cultural values.
3-    To expand the range of economic and social choices available to individuals and nations.

Q3: Write a detailed note on Millennium Development Goals (MDGs). Also mention the relevant targets.
 Millennium Development Goals (MDGs)
The internationally agreed framework of 8 goals and 18 targets was complemented by 48 technical indicators to measure progress towards the Millennium Development Goals. These were established following the Millennium Summit of the United Nations in September, 2000, following the adoption of the United Nations Millennium Declaration. All 189 United Nations member states at the time (there are 193 currently), and at least 23 international organizations, committed to help achieve the following Millennium Development Goals by 2015 These indicators have since been adopted by a consensus of experts from the United Nations, IMF, OECD and the World Bank. 
1-    Eradicate extreme poverty and hunger

Target 1. Halve, between 1990 and 2015, the proportion of people whose income is less than $1 a day
Target 2. Halve, between 1990 and 2015, the proportion of people who suffer from hunger

2-    Achieve universal primary education
Target 3. Ensure that, by 2015, children everywhere, boys and girls alike, will be able to complete a full course of primary schooling

3-     Promote gender equality and empower women
Target 4. Eliminate gender disparity in primary and secondary education, preferably by 2005, and in all levels of education no later than 2015

4-    Reduce child mortality [1]
Target 5. Reduce by two-thirds, between 1990 and 2015, the under-five mortality rate

5-     Improve maternal health
Target 6. Reduce by three-quarters, between 1990 and 2015, the maternal mortality ratio.

6-    Combat HIV/AIDS, malaria, and other diseases
Target 7. Have halted by 2015 and begun to reverse the spread of HIV/AIDS 
Target 8. Have halted by 2015 and begun to reverse the incidence of malaria and other major diseases

7-    Ensure environment sustainability
Target 9. Integrate the principles of sustainable development into country policies and programs and reverse the loss of environmental resources
Target 10. Halve, by 2015, the proportion of people without sustainable access to safe drinking water and basic sanitation
Target 11. Have achieved by 2020 a significant improvement in the lives of at least 100 million slum dwellers

8-    Develop a global partnership for development
Target 12. Develop further an open, rule-based, predictable, nondiscriminatory trading and financial system (includes a commitment to good governance, development, and poverty reduction both nationally and internationally.
Target 13. Address the special needs of the Least Developed Countries (includes tariff-        and quota-free access for Least Developed Countries exports, enhanced program of debt relief for heavily indebted poor countries [HIPCs] and cancellation of official bilateral debt, and more generous official development assistance for countries committed to poverty reduction)
Target 14. Address the special needs of landlocked developing countries and small island developing states (through the Program of Action for the Sustainable Development of Small Island Developing States and 22nd General Assembly provisions)


Target 15. Deal comprehensively with the debt problems of developing countries through national and international measures in order to make debt sustainable in the long term
Target 16. In cooperation with developing countries, develop and implement strategies for decent and productive work for youth
Target 17. In cooperation with pharmaceutical companies, provide access to affordable essential drugs in developing countries
Target 18. In cooperation with the private sector, make available the benefits of new technologies, especially information and communications technologies.


Q4: What are the basic indicators of development.
Basic indicators of development: Real income, health and education
Real income
Total market value of all final goods and services produced in a country by all residents and nonresidents is gross national product GNP. If the difference between income received by residents from abroad for factor services (labor and capital) and payments made to nonresidents who contribute the domestic economy is deduced from GNP, we will be left with GDP, gross domestic product. GNP is the most commonly used measure of overall economic activity.
One way to make comparison between developed and less developed countries (LDCs) is per capita real GNP. This is done by converting per capita real GNP of all countries to single measure that is US dollar. This process involves official foreign exchange rates and therefore, is exaggerated when the currencies of LDCs is converted to US dollar. This problem is rectified by focusing on another concept that is purchasing power parity (PPP). It is defined as the number of units of a foreign country’s currency required to purchase the identical quantity of goods and services in the local market of LDC as $1 would buy in the United States. Exchange rate will adjust to equalize the purchasing power of a unit of a currency in all countries. At PPP, buyers are indifferent to purchase among countries. PPP is simply a mutual comparison of purchasing powers.
The concept of PPP has benefits over GNP at exchange rate. For example, the income gap between the richest country, USA and the poorest country, Ethiopia is 56 to 1 at PPP and 403 to 1 at exchange rate in 2000. One of major weaknesses of income at exchange rate is volatility of exchange rate fluctuations that affects GNP and GDP comparisons badly. GNP shows economic strength of a country whereas PPP shows cost of living or quality of life (purchasing power) which is more reliable indicator.
Per capita GNP in 1997 – in USD at official exchange rates
Switzerland
44320
Japan
37850
US
28740
Canada
19290
Brazil
4720
China
860
Pakistan
490
India
390
Nigeria
260
Ethiopia
110


Health
Life expectancy: there is also striking difference between developed and least developed countries, for example, in 1960, it was 75 to 48 years.
Infant mortality rate- the number of babies who die before their first birthday out of every 1,000 live births. It was 96, 48 and 8 in least developed, developing and developed countries respectively in 1998.
Malnutrition; The even bigger problem than poverty. According 2001 statistics; among the poor 1 billion do not have access to safe drinking water; 2.4 billion – half the population – live without sanitation facilities and 158 million children under age 5 are underweight.
AIDS: there are 22 million died of this fatal disease and 36 million got HIV up to 2001, 90% of all these belong to least developed countries.
Education
It is also a major indicator. In least developed countries 45% is average literacy rate; 325 million children have dropped out of primary and secondary school; 854 million illiterate adults out of which 60% are women (survey 2001)
Q5: What are the characters developing countries have in common?
Common characters of low living levels of developing countries
1-    Low as well as slow rates of income growth.
2-    Low as well as stagnating rates of real income per capita growth.
3-    Highly skewed patterns of income distribution.
4-    Large segment of population is suffering from absolute poverty.
5-    Large segment of population is characterized with ill health, malnutrition, high infant mortality rates.
6-    Low levels of literacy, significant dropout rates and inadequate and irrelevant educational curricula and facilities.


     Q6: What are primary growth factors?
1-    Capital accumulation including all new investments.
2-    Population growth giving rise labor force.
3-    Technological progress.


Capital accumulation
Capital is that part of wealth which is used to generate further income. There are two major kinds of capital; human capital and non-human or physical capital. Human capital consists of education, skills, capabilities, etc. Examples of non- human capital are machines, buildings, infrastructure - roads, water, electricity, sanitation, communications, etc. physical capital stock of a nation is the total net real value of all physically productive capital goods.
Capital accumulation is the process of adding more capital to existing capital stock. Capital accumulation is the result of investment that is in turn result of saving. Saving shows that the society is willing to sacrifice today consumption to get more in future.
Capital accumulation cycle
E   Y  S I K E Y S I K   E Y S I K   E Y S I K
E = Employment, Y= income, S= saving, I= investment, K= capital accumulation
Population growth giving rise labor force.
Second major factor that guarantees development is population growth. An increase in population growth obviously results in more labor force. But, both positive and negative impacts of population growth are likely. Least developed and developing countries are rich in population still they are not developed. It depends on the economic system of a country how it utilizes its labor. Population growth is also necessary to develop markets that are very important factor in free market economy.
More population → more labor force → bigger markets both for labor and output

Technological progress
Technology is new and improved ways of doing things such as growing crops, making clothing or building a house. There are three categories of technological progress:
1-    Neutral technological progress
It takes place when higher output is achieved with same quantity and combination of factors of production. Division of labor is only possible innovation that can be expected in this type. Production possibility front will simply shift outward
2-    Laborsaving technological progress
It is due to use of advanced machines such as computers, automated looms, high speed electric drills, tractors, etc. The fastest technological progress since last century is also due to laborsaving technology. It is also known as capital intensive technology and common in developed countries because these countries are rich enough to launch heavy research.
3-    Capital saving technological progress
It is common in developing countries where labor force is abundant and heavy machinery and research is out of reach. It is also known as labor intensive technology. Only small and limited machines are used.
4-    Labor augmenting technological progress
It occurs when quality or skills of labor force are upgraded such as use of multimedia and other communication media for class room instructions.
5-    capital augmenting technological progress
It occurs when quality and productivity of capital goods is improved such as substitution of threshers for simple machines.
Q7 How production possibility front technique is helpful in growth analysis
Production possibility function (PPF) analysis
PPF shows the maximum attainable output of two commodities, for example rice and computer, that a country can produce potentially when all factors are fully and efficiently employed.


If a country is not on PPF, it means the country is underproduction and input factors are lying idle, for instance, at point k. In the case of neutral technological progress the whole front shifts out.


In case of agricultural progress (rice), the portion PPF on x-axis will come out in proportion with the development in the agricultural sector.


Development in industrial segment (computer) of economy will be indicated by outward shift of PPF on y-axis in proportion with the development in the industrial sector.


-----------------------------------------------------------------------------------------------------------


Q8 How low income countries today differ from developed countries in their earlier stages
1.    Physical and human resource endowments.
2.    Per capita incomes and levels of GNP in relation to the rest of world.
3.    Climate
4.    Population size, distribution and growth.
5.    Historical rate of international migration.
6.    International trade benefits.
7.    Basic scientific and technological research and development capabilities.
8.    Stability and flexibility of political and social institutions

Physical and human resource endowments
By physical and human resource endowment we mean economic benefits that a country has over other countries. Examples are fertile lands, petroleum, mines and healthy, skilled and satisfied labor force. One of the reasons of long run growth of today developed is that these countries were rich in such endowments. A few developing nations have been supplied with abundant supply of petroleum, other minerals and raw materials. In Asia where almost half of the world population resides is poorly endowed with natural resources. In contrary, the countries where natural resources are in plenty such as Latin America and Africa heavy investment of capital is needed to exploit them.
       Human resources is also a big difference between developing and developed nations. The developing nations lack skilled labors though their labor force is much larger as compared to the developed nations. According to Paul Romer “ today developing nations are poor because their people do not have access to the ideas that are necessary to generate value by industrialization.”
Per capita incomes and levels of GNP in relation to the rest of world
The four fifths of the world population at present living in developing countries have on average a lower level of real per capita income than their counterparts had in nineteenth century. Especially, at the beginning of modern growth era today developed countries were economically in advance of the rest of the world. Therefore, they were in strong position to expand financially and economically.
Climate
Almost all developing countries are located in tropical or sub tropical (most heated) zones. On the other hand most economically successful countries located in the temperate zones. The difference of climate is not by chance. The heat and humidity in most countries contribute bad soil quality and rapid losses to many natural goods. Extreme climate has also affected badly the thickness of forests, bad health of animals and productivity of certain crops. Bad weather also causes discomforts and diseases among works making them less productive.
Population size, distribution and growth
One more striking difference between the poor and the rich world is population growth and distribution. In the beginning the Western nations had very slow population rates. It increased during industrialization era due to falling death rates, however birthrates remained slow. The average population growth rate was 2% per annum and even much less of it.
The population of developing countries increased at higher average that is 2.5% and even faster. Further population is concentrated in few areas and person to land ratios are higher than the developed countries had in the start. In the term of absolute size the developing countries have also grown larger such as India, Egypt, Pakistan, Indonesia, etc.
Historical rate of international migration
In the early twentieth centuries there was a great movement of rural population in Europe giving rise large scale international migration. It was due to famine and less economic opportunities in rural areas. Especially, after World War a huge number of unskilled labors Europe rushed to labor shortage areas of North America and Australia.
This international migration can be divided into two major types: distant (remote) and long run; short distance and temporary. The first types includes migration from Europe to America (the new world) whereas the second includes migration within the Europe. It took place after World Wars; however, the reasons of migration were almost same in both the types.
One of the major consequences of international migration is brain drain. It means the migration of highly skilled professionals from developing countries to developed countries in search of better livelihood. The brain drain during 1960 to 1990 was more than one million from developing countries to Canada, USA and UK. Further, international migration affects wage rates, remittances and cultural values.
International trade benefits
International free trade is known as “growth engine” which caused all advancements in today developed countries. Free trade helped expansion of exports markets which further provided international stimulus to growing local demands. This caused establishment of manufacturing industries and enabled developing countries to borrow funds from international capital markets and speed up the process of capital accumulation.
Free trade and prosperity cycle
More international free trade → more expanded exports markets → more earnings → more manufacturing industries → more borrowable funds for developing countries → more capital accumulation with developing countries → more development in developing countries.
Unfortunately, the developing countries have benefited less out of free trade due to their poor terms of trade (value of exports to value of imports).
Basic scientific  and technological research and development capabilities
Research and development (R& D) has played very crucial role in development of today developed countries. This is why 90% of world research is being done in developed countries. These countries can afford scientific research because they allocate heavy funds for this purpose in their budgets. Scientific research and development has been in the top priorities of developed countries whereas the developing countries neither can afford nor they have such priorities; instead they depend on the developed countries for research projects if they have them at all.
Stability and flexibility of political and social institutions
Finally, today developed nations had in beginning established political and flexible social institutions. Therefore, they could pursue national policies independently on basis of consensus toward modernization. According to Gunnar Myrdal, the Nobel Prize laureate:
 “….the today developed countries had a small world of broadly similar cultures where person and ideas moved freely. Modern scientific thought developed in these countries long before industrialization revolution and modernized technology was introduced earlier in their agriculture and industries in small scale.”
The political stability had been also a problem for developing countries; they lacked national policies consistency and sustainability. On the other hand, the developed nations showed themselves more mature in their political temperament. The continuity of economic policies through years and years is salient feature of developed countries.
…………………………………………………………………………………………………….


Q9 How can we measure inequality and poverty
1-    Size distribution method
The personal or size distribution of income is most commonly used measure of inequality used by economist. It simply deals with individual persons or households and the total income they receive regardless the source of income.
1.    Write the individuals and their income in ascending order.
2.    Divide the population in quintile and deciles
3.    Divide top 20% by bottom 40%: the greater the difference; the greater the inequality.
      INDs
PI(MU)
      %STI
Quintiles
Deciles
1
0.8
2
1
1.8
3
1.4
4
1.8
5
3.2
5
1.9
6
2
3.9
7
2.4
8
2.7
9
5.1
9
2.8
10
3
5.8
11
3.4
12
3.8
13
7.2
13
4.2
14
4.8
9
15
5.9
16
7.1
22
13
17
10.5
18
12
22.5
19
13.5
20
15
51
28.5
100
100
100


2-    Lorenz curve
The Lorenz curve is a graphical representation of the distribution of income or of wealth. It was developed by Max O. Lorenz in 1905 for representing inequality of the wealth distribution.
1.    The numbers of income recipients are plotted on x-axis in cumulative percentage.
2.    The vertical axis shows share of income received by each percentage of population, it is also in cumulative up to 100.
3.    The diagonal shows equality- at every point the percentage of income is equal to percentage of population.
4.    The Lorenz curve shows the actual income received by each group of population. The more away the Lorenz curve from diagonal, the more is inequality.


3-    Gini coefficient
It is the area covered by Lorenz curve divided by the total area on the right side of diagonal:
Lorenz curve area / Area of triangle on right side of diagonal
If it is
1.    =0, perfect equality
2.    =1, perfect inequality
3.    Generally it is between 0 and 1
4.    For more equitable countries, it is 0.20 to 0.35 and for less equitable countries it is 0.50 to 0.70


-------------------------------------------------------------------------------------------
Q 10  What are the characteristics of high poverty groups

1.    Rural Poverty
2.    Women and Poverty
3.    Ethnic Minorities, Indigenous Population, and Poverty
Rural Poverty
The most valid things about the poor are that they are mostly located in rural areas; they are primarily engaged in agriculture. They are more likely to be women and children than adults male and also they are concentrated among minority ethnic groups and indigenous people. Surveys show that two-thirds of very poor people earn their livelihood from agriculture as small farmers or paid farm workers. Remaining one-third are engaged in petty jobs and live in rural areas and some live marginal urban areas and involved in self employments.
Very interesting facts about rural poverty are that the largest share of most LDCs government expenditures  in past 25 years are directed toward urban areas, especially on affluent commercial and manufacturing areas; however these funds should have gone to rural areas for alleviation of poverty.
Women and Poverty
Women constitute substantial majority of world population. If we compare the lives of inhabitants of the poorest communities across the developing world; we will find that children and women experience the harshest deprivation. They are more likely to be poor and malnourished less likely to receive medical services, sanitation, clean water and other benefits. The women have less access to government jobs, social security  and less control on their spouse income. The households headed by women having no male earners are 20% in India; 17% in Costa Rica; 40% in rural Kenya and this proportion is rising throughout the developing countries.
The disparity of income between male and female headed households can be explained by large earnings differentials. The reasons are: less payment to women for similar tasks; they are barred from highly paying jobs; they are offered less productive and illegal job. Per capita income and household income are poor indicators of poverty because they do not consider gender discrimination. Instead of this, the economic status of women is better indicator. Present intrahousehold studies show the existence of a strong bias against women in different regions of the developing countries; for example boys are 40 times more likely to be taken to hospitals when ill.
Ethnic Minorities, Indigenous Population, and Poverty
The final conclusion about incidence Third World poverty is presence of ethnic minority groups and indigenous populations. Of 40% nation-states of the world have more than  5 sizeable ethnic populations one or more of which face serious economic or political       threat. The plight against 300 million indigenous populations of 70 countries was exposed by UNO in 1993 when this year was declared as Year of Indigenous People. Not only the domestic disputes but world wars had arisen out of ethnic discriminations. For example, in Mexico 80% indigenous are indiscriminately poor in face of 18% of rich non-indigenous people.


Working definition of indigenous peoples by Jose R. Martinez Cobo
Indigenous communities, peoples and nations are those which, having a historical continuity with pre-invasion and pre-colonial societies that developed on their territories, consider themselves distinct from other sectors of the societies now prevailing on those territories, or parts of them. They form at present non-dominant sectors of society and are determined to preserve, develop and transmit to future generations their ancestral territories, and their ethnic identity, as the basis of their continued existence as peoples, in accordance with their own cultural patterns, social institutions and legal system.
This historical continuity may consist of the continuation, for an extended period reaching into the present of one or more of the following factors:
  • Occupation of ancestral lands, or at least of part of them
  • Common ancestry with the original occupants of these lands
  • Culture in general, or in specific manifestations (such as religion, living under a tribal system, membership of an indigenous community, dress, means of livelihood, lifestyle, etc.)
  • Language (whether used as the only language, as mother-tongue, as the habitual means of communication at home or in the family, or as the main, preferred, habitual, general or normal language)
  • Residence in certain parts of the country, or in certain regions of the world
  • Other relevant factors.
On an individual basis, an indigenous person is one who belongs to these indigenous populations through self-identification as indigenous (group consciousness) and is recognized and accepted by these populations as one of its members (acceptance by the group). This preserves for these communities the sovereign right and power to decide who belongs to them, without external interference.
           indigenouspeoples.nl/indigenous-peoples/definition-indigenous


[1] Child mortality, also known as under-5mortality or child death, refers to the deathof infants and children under the age of five or between the age of one month to four years depending on the definition.
The maternal mortality ratio (MMR) is the ratio of the number of maternal deaths during a given time period per 100,000 live births during the same time-period.